DATA COLLECTION
Common question(s) that typically prompt a habitat survey are:
- Where is the submerged habitat in a waterbody?
- What types of habitat are available in the waterbody?
- Is the available habitat likely to hold fish?
Infofish Habitat mapping as a process is designed to provide maximum resolution imagery on aquatic habitat to facilitate assessment and classification of habitat zones.
PRE-PLANNING
Depending on the need the survey transects are predesigned with prevailing winds and natural geography in mind, such that the operator can focus on the task of data collection, rather than decision making during the day. A typical startup pattern will include 100m separated parallel transects, with 2-3 orientations based on wind conditions, such that if wind patterns are not suitable changes can be made.
EQUIPMENT
The following equipment is used during the process:
- Survey Vessel, 4-4.2m Exemption 38 Vessel registered with AMSA for research purposes.
- 2 x Humminbird Helix 10 Units for recording bathymetry, gps locations/tracks and 1.2MHz/455MHz sidescan
SAFETY MANAGEMENT
As per AMSA requirements all surveys operate under a dedicated survey management plan that is designed to ensure the safe conducting of bathymetric surveys. A copy of our standard safety management plan is available from the Infofish Surveys Website (https://infofishsurveys.com.au) or email upon request.
HANDLING OF DATA
Data from the surveyed area is recorded on both of the Helix units during survey, so as to provide redundancy in case of a unit failure or other issue on water.
- Primary Unit (directly records sonar and gps data) – using the AutoChart feature and recorded to a Humminbird Zero Lines SD card for Australia.This unit is dedicated to recording bathymetric logs during the day.
- Secondry Unit (networked and taking data from the primary unit) -using a standard encrypted SD card. This unit is dedicated to recording sonar logs as well as backup bathymetric logs during the day. Sonar logs record raw data from the transducer including Sidescan and 2D data.
HANDLING UNFORSEEN CONDITIONS
From time-to-time weather conditions or artifacts on water make operating using the pre-planned set of transects difficult to impossible. In this case, rather than halting survey, the operator can run a single line either parallel to land, or away from the edge as required, then use survey range rings on the Helix unit to continue with additional lines at the 100m spacing parallel to the starting line. This is done by setting the range required (100m) on the survey unit, which will draw a ring of the selected range as the radius and orienting the boat directionally parallel to the start line, using the radius of the range ring to keep a consistent distance from the start line. This can be continued as many times as needed allowing for surveys to continue even in unforeseen conditions.
DAILY REVIEW
Data collected during the survey day is uploaded and processed overnight at head office, for external review to determine if features that need additional data have been identified, and that data collected to data is of sufficient spacing to accurately develop a working bathymetric map.
ON WATER SURVEY
The waterbody is commonly a riverine environment or enclosed waters e.g., dam / impoundment and the survey approach can vary slightly between the two. Survey reaches in a riverine environment are typically as long as achievable in two directions e.g., upstream and downstream in a day (especially in tidal affected areas) however, the length can vary as necessary. Survey zones in enclosed waters typically cover the whole of the waterbody. Once a survey reach (riverine) or zone (impoundment) has been defined, the survey methods for each are as follows:
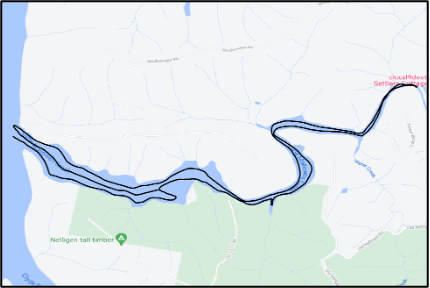
Riverine (Figure 1):
- two longitudinal transects (one upstream and one downstream) with the vessel travelling parallel to the bank, and
- additional longitudinal transects along the centre of a channel with the vessel travelling parallel to the bank to fill in any wider sections, where required.
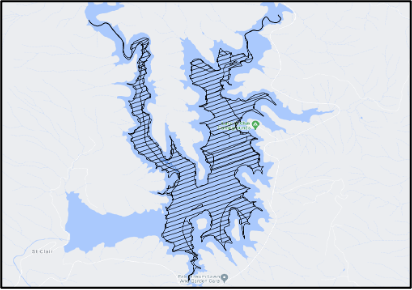
Enclosed waters / impoundment (Figure 2):
- a shoreline / edge survey of the entire waterbody, and
- a number of transects across the waterbody, spaced 100m apart. Note: transect orientation varies between waterbodies, however, are typically aligned to run perpendicular to the orientation of the waterbody.
RAW HABITAT DATA
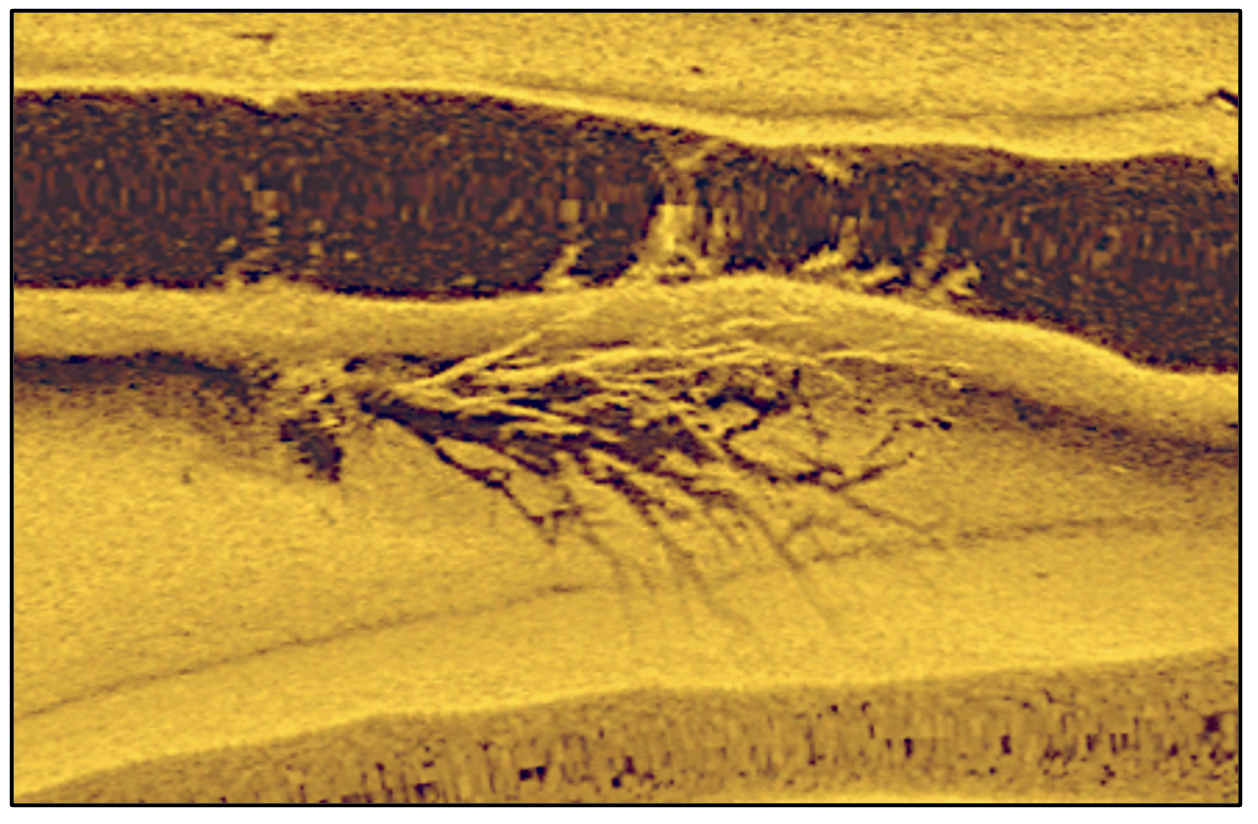
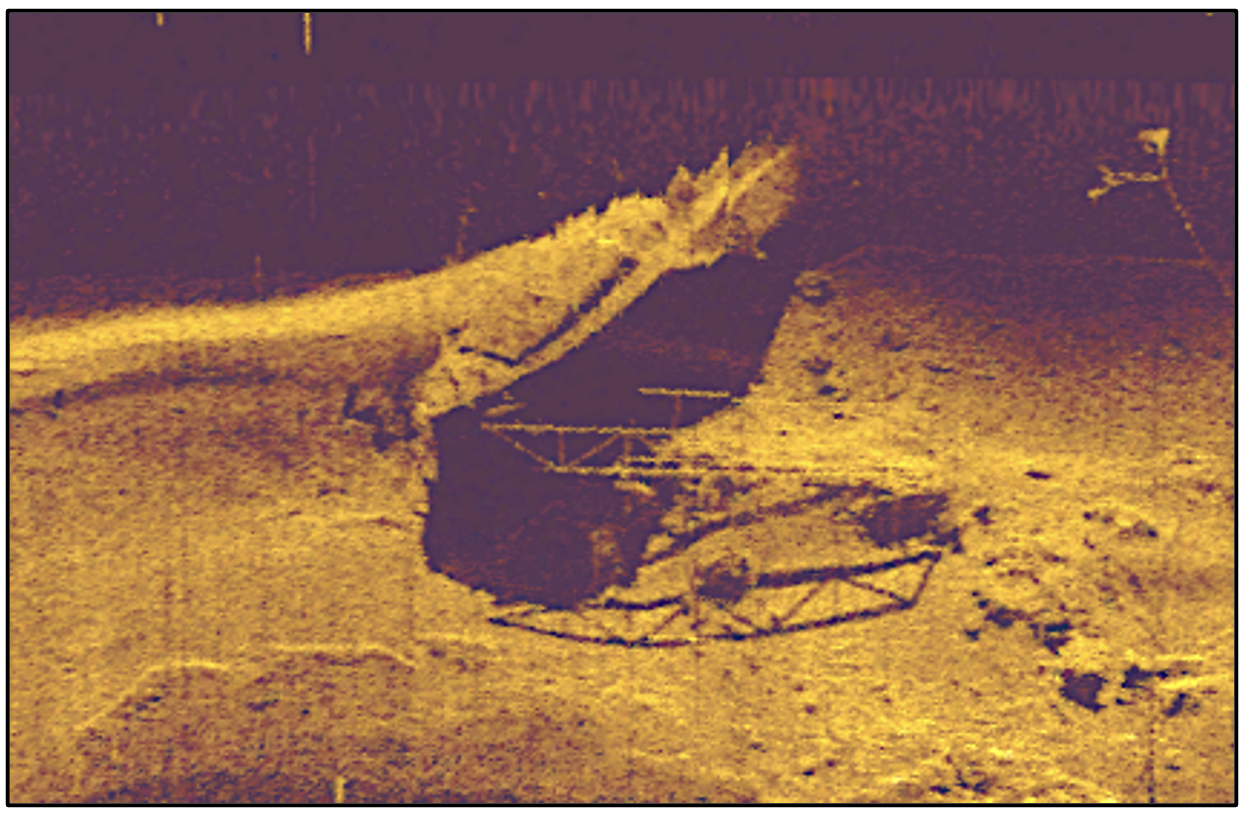
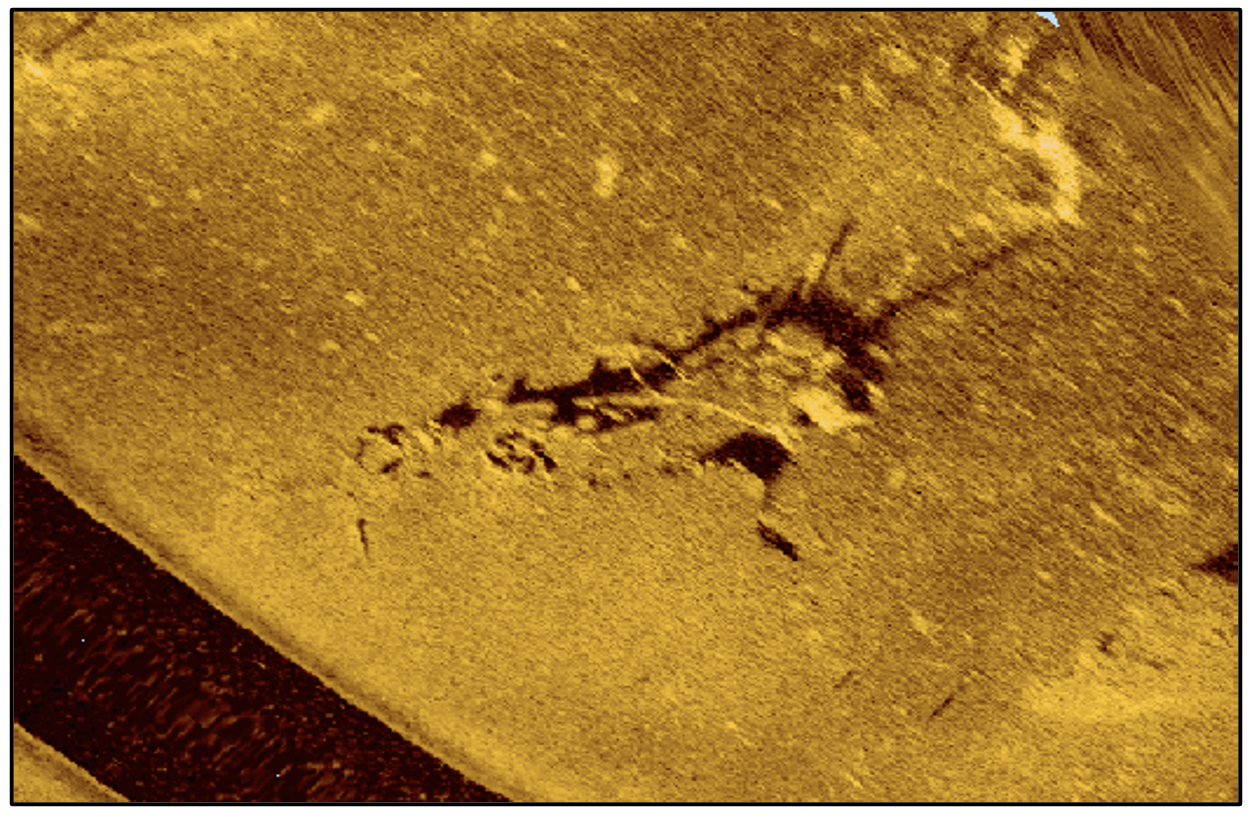
Raw aquatic habitat data is collected using the Humminbird Helix 10 Mega Side Imaging GPS fish finder (Helix) or the Solix 12 Chirp Mega Side Imaging GPS fish finder (Solix). The sidescan imaging data from a unit is recorded along each transect and saved to an SD card. The data is collected at the highest resolution possible for the type of waterbody being surveyed. In shallow (<10m) river or creek settings, the data is collected at 1.2 kHz (mega) producing high resolution imaging, while in large / deeper bodies of water, the data is best collected at lower frequencies (455 or 800 kHz) to gain greater coverage either side of the boat. Examples of habitat and anthropogenic structures side scanned at high and lower resolution are displayed in Figure 3. The raw sidescan imaging provides qualitative information on the types and locations of habitats (wood / snags, seagrass beds, freshwater aquatic plant beds, natural and anthropogenic structures, etc.) in a surveyed area.
ANALYSIS
HABITAT MOSAIC CREATION
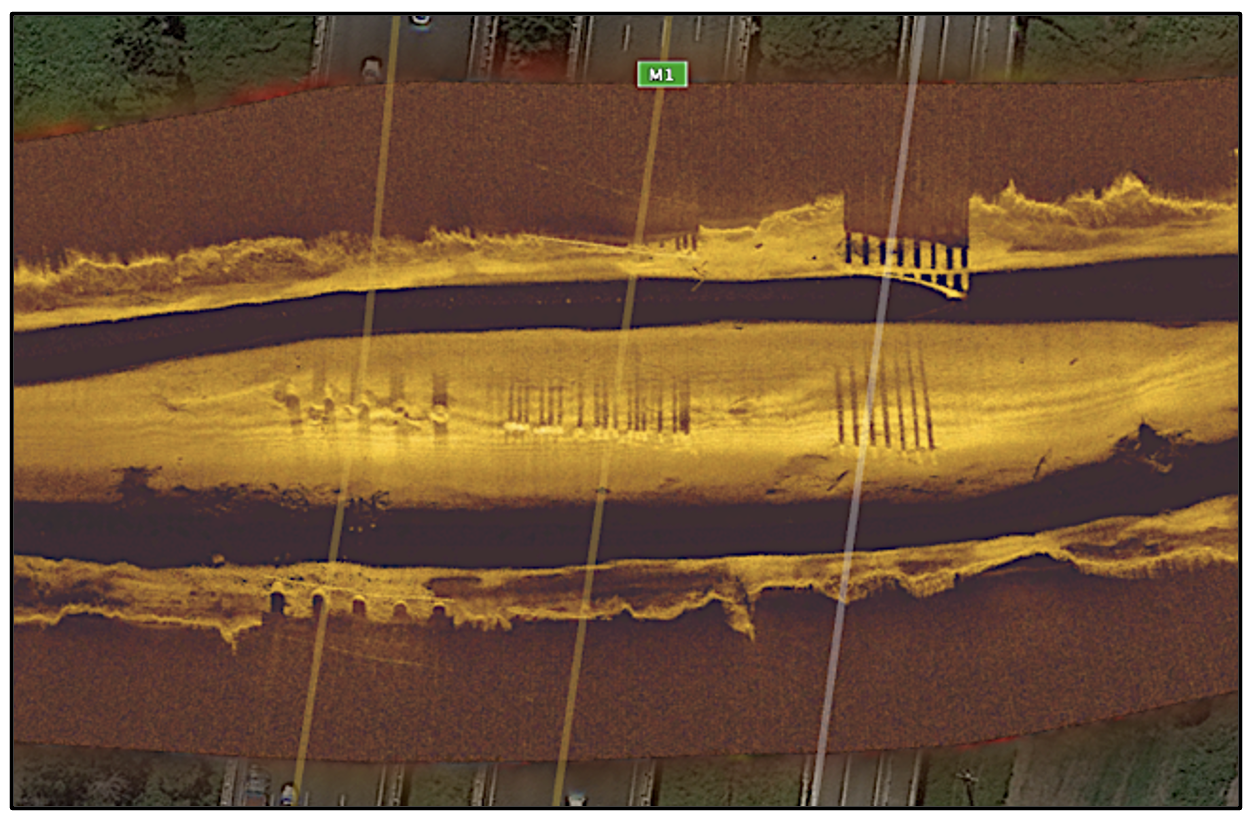
All raw sidescan imaging is uploaded to ReefMaster. A habitat mosaic is made up of an edge or shoreline scan of a lake and numerous cross-transects, spaced 50 or 100m apart, depending on the transducer frequency setting being used. The recordings are edited to keep only the best sections of imagery and remove the sweeping / distorted imagery that occurs during vessel turns. All accepted imagery is then compiled into a single map and blended to provide the clearest image possible. Completed mosaics are exported in .MBTiles format and used in habitat / structure classification review. See Figure 4 for an example raw sidescan mosaic.
HABITAT CLASSIFICATION
The raw sidescan image mosaic is displayed in QGIS. A classification shapefile layer is created and where a habitat element type is observed on the habitat mosaic, is marked with a GPS point and classified. The most commonly observed and classified habitat elements range from naturally occurring wood and rock, to anthropogenic structures like sunken boats to pontoons. The level to which classification occurs is typically project specific. The common habitat types and their classifications are presented in Table 1.
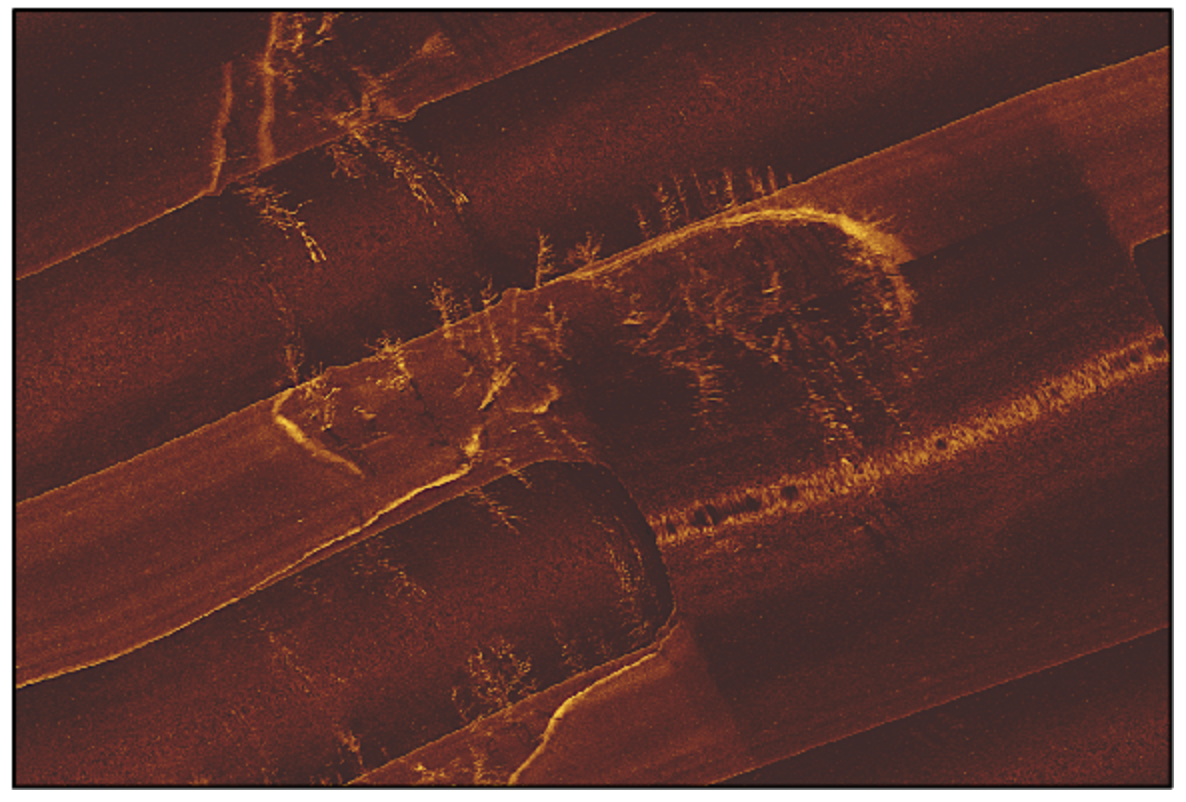
Where habitat elements are extensive or too numerous to mark individually, habitat type specific polygons are used to delineate these areas. See Figure 5 a) and b) for an example habitat polygon delineating a submerged tree line along a creek.
|
Description |
Example |
Classification |
|
Wood |
||
|
A single trunk or branch: a root mass or small part of a branch may be present. |
|
W1 |
|
Double trunk or branch or single trunk with one level of branching for most of the length. |
|
W2 |
|
Trunk with multiple branches for most of length, with 2nd level of branching present. |
|
W3 |
|
Complete tree with extensive branching or an accumulation of large wood in which individual pieces could not be resolved. |
|
W4 |
|
Rock |
|
|
|
A single large (>0.5m) rock protruding from the bed or bank. |
|
R1 |
|
Numerous individual large (>0.5m) scattered rocks on bed or bank. |
|
R2 |
|
A rock bar protruding from bed or bank. |
|
R3 |


MAPPING OUTPUTS
HABITAT MOSAICS
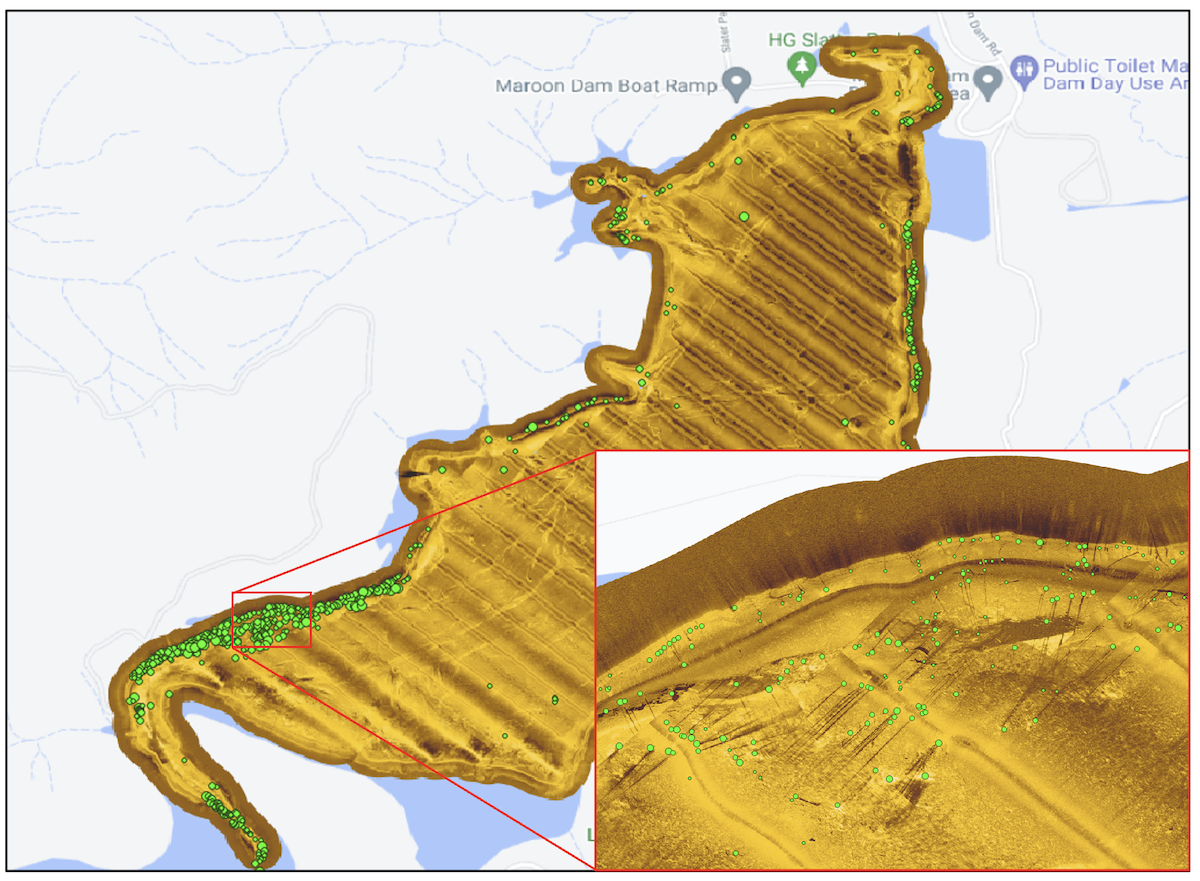
Habitat mosaics are the base level of qualitative information and presented in web-based mapping platforms like Mapbox Studio[1]. In the post processed data review process, the mosaics are viewed in tandem with fish biomass spatial data. They are a key part of this process, particularly in dams or areas of dams that contain extensive submerged tree lines or fields of felled trees, rock bars / gravel beds etc. The review confirms that a sufficient number of signals has been rejected by the data processor in these areas, which can erroneously inflate fish biomass estimates. The mosaics presented in Mapbox Studio are interactive and made available to clients and stakeholders where necessary. Links to existing interactive habitat mosaics can be provided upon request.
CLASSIFIED HABITAT
Classified habitat provides information on the locations and complexity of habitat present in a surveyed area. This information is used in fish distribution mapping and habitat association investigations. It is also displayed as an interactive layer in the Infofish Explorer mobile phone application.