DATA COLLECTION
Bathymetry data is collected using Humminbird Helix Mega SI GPS fish finders (Helix) in a survey pattern designed to produce a map that accurately defines the underwater structure of the water body.
PRE-PLANNING
Depending on the need the survey transects are predesigned with prevailing winds and natural geography in mind, such that the operator can focus on the task of data collection, rather than decision making during the day. A typical startup pattern will include 100m separated parallel transects, with 2-3 orientations based on wind conditions, such that if wind patterns are not suitable changes can be made.
EQUIPMENT
The following equipment is used during the process:
- Survey Vessel, 4-4.2m Exemption 38 Vessel registered with AMSA for research purposes.
- 2 x Humminbird Helix 10 Units for recording bathymetry, gps locations/tracks and 1.2MHz/455MHz sidescan
SAFETY MANAGEMENT
As per AMSA requirements all surveys operate under a dedicated survey management plan that is designed to ensure the safe conducting of bathymetric surveys. A copy of our standard safety management plan is available from the Infofish Surveys Website (https://infofishsurveys.com.au) or email upon request.
HANDLING OF DATA
Data from the surveyed area is recorded on both of the Helix units during survey, so as to provide redundancy in case of a unit failure or other issue on water.
- Primary Unit (directly records sonar and gps data) – using the AutoChart feature and recorded to a Humminbird Zero Lines SD card for Australia.This unit is dedicated to recording bathymetric logs during the day.
- Secondry Unit (networked and taking data from the primary unit) -using a standard encrypted SD card. This unit is dedicated to recording sonar logs as well as backup bathymetric logs during the day. Sonar logs record raw data from the transducer including Sidescan and 2D data.
HANDLING UNFORSEEN CONDITIONS
From time-to-time weather conditions or artifacts on water make operating using the pre-planned set of transects difficult to impossible. In this case, rather than halting survey, the operator can run a single line either parallel to land, or away from the edge as required, then use survey range rings on the Helix unit to continue with additional lines at the 100m spacing parallel to the starting line. This is done by setting the range required (100m) on the survey unit, which will draw a ring of the selected range as the radius and orienting the boat directionally parallel to the start line, using the radius of the range ring to keep a consistent distance from the start line. This can be continued as many times as needed allowing for surveys to continue even in unforeseen conditions.
DAILY REVIEW
Data collected during the survey day is uploaded and processed overnight at head office, for external review to determine if features that need additional data have been identified, and that data collected to data is of sufficient spacing to accurately develop a working bathymetric map.
ON WATER SURVEY
The broad brush of the water body needs to be assessed efficiently so as to maximise the time available for teasing out features in the bathymetry. With this in mind the opening approach is adapted based on the type of water body as follows:
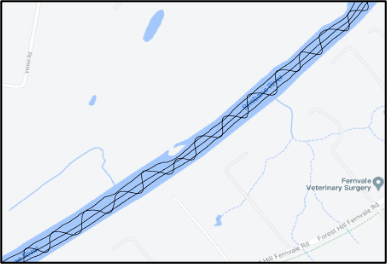
Considerations for Riverine (Figure 1):
- A serpentine navigation of the river channel from bank to bank, moving up or downstream
- two longitudinal transects (one upstream and one downstream) with the vessel travelling parallel and as close to the bank as possible, and
- a mid-channel transect that follows the deepest point of the channel along the survey reach.
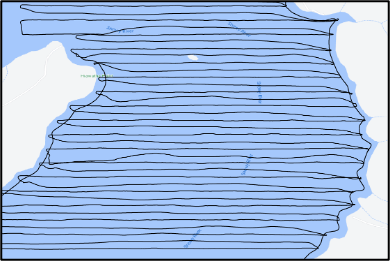
Considerations for Enclosed waters / impoundment ( Figure 2):
- a shoreline / edge survey of the entire waterbody, and
- a number of transects across the waterbody, spaced 100m apart, and a return track in between as the vessel returns to the start point for the next fish biomass transect. Transect are aligned so that the majority run perpendicular to the dam alignment and / or submerged river channel.
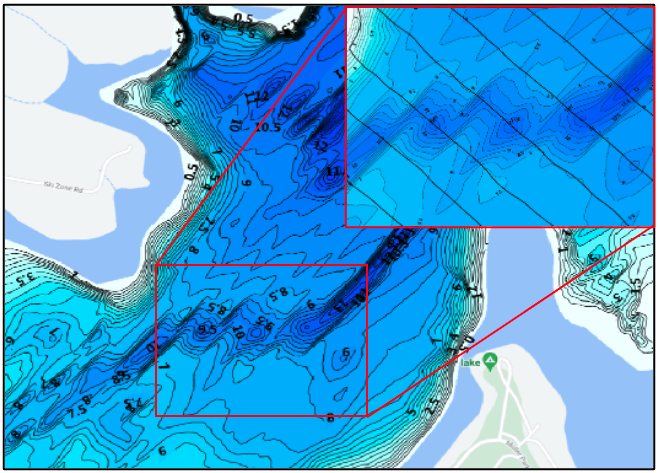
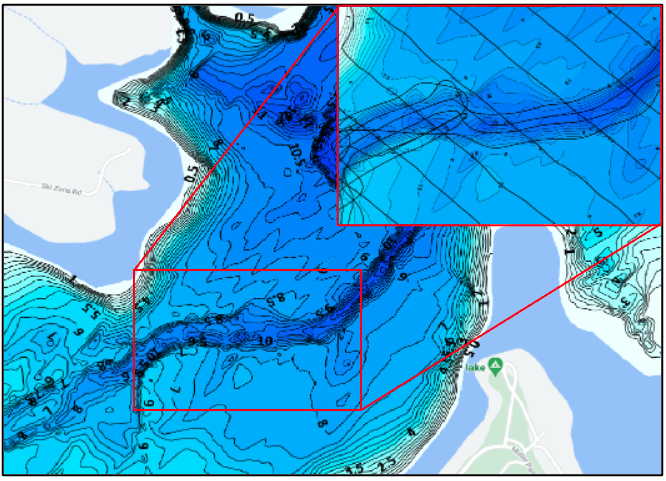
SPECIFIC FEATURE MAPPING
Where pre-defined impoundment survey transects cut across a submerged river channel acutely, the channel definition can be poor or look stepped when mapped (Figure 3). To improve the data resolution and mapping imagery, additional survey of the channel using a survey pattern similar to that used in a riverine environment is completed (Figure 4). The additional channel shape data assists with improved fish biomass post processing also, as the channel banks can return numerous echoes and signals that can inflate biomass estimates. Similarly features such as sunken islands, ravines and drop-offs can be teased out with additional survey lines.
ANALYSIS
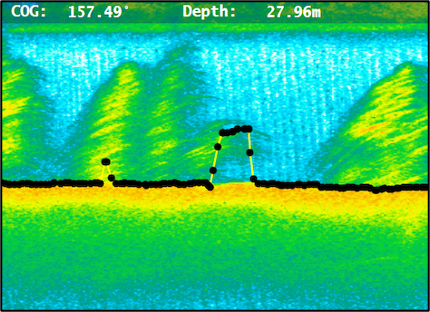
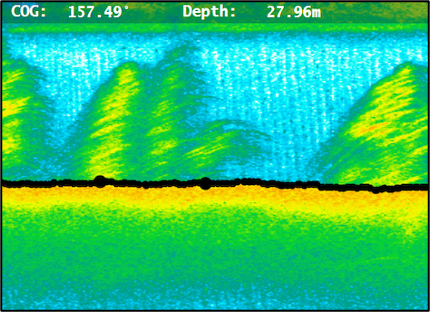
BOTTOM LINE REVIEW AND CORRECTION
All bathymetric data is reviewed using the ReefMaster software and corrected where the bottom readings have been calculated incorrectly. Errors in bathymetric detections bottom are common where the substrate is large rocks or boulder fields, steep drop-offs and river channel banks passed over at speed, where submerged standing timber is extensive or when water surface is wind chopped and the transducer leaves the water temporarily. See Figure 5 a) for where the bottom line (dark line) was calculated incorrectly due to standing submerged timbers and b) after it had been corrected. Once the data has been reviewed and corrected, where necessary, all data files from a survey are compiled in ReefMaster.
ZERO LINE GENERATION
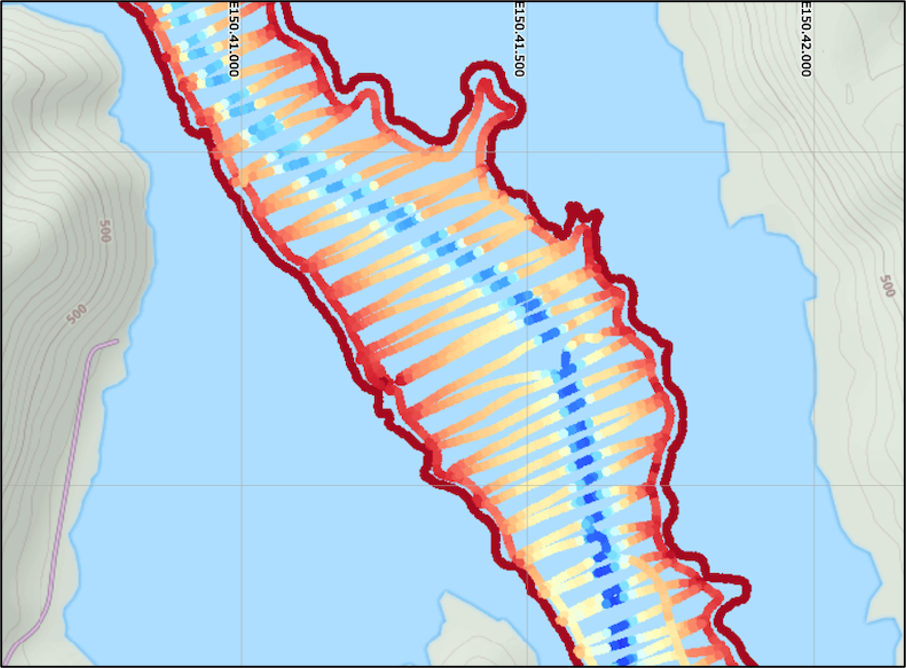
The shoreline / edge sidescan imagery from the habitat survey is used to generate a zero line or the point at which the water meets the land at the time of survey. The imagery is compiled in ReefMaster and exported as a .kmz file then imported to Google Earth Pro. From the sidescan imagery, the zero line is created by tracing the water’s edge using the polygon tool in Google Earth (Figure 6). A separate zero line is generated for any islands present in a survey area also. The polygon(s) is exported as a .kmz and imported to ReefMaster, then added to the complied bathymetry data from the survey. See Figure 7 for raw boat tracks data with zero line (red) included, prior to map image generation.
Where water levels change during a survey from inflows or releases from impoundments or in tidal areas, water level offsets are calculated and applied to the dataset. Water level change information is obtained via water manager websites or Bureau of Meteorology tidal stations. Bathymetry data is exported in .kml, .MBTiles and .csv formats and used in the machine learning and modelling data analyses.
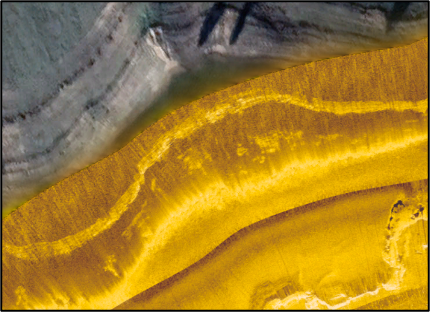
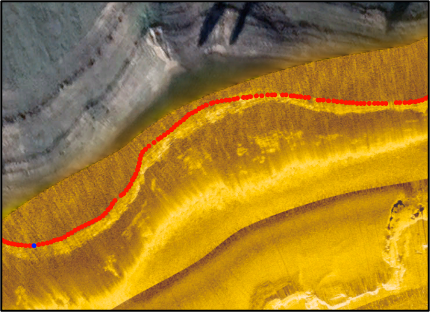
Figure 6. Sidescan imagery used to generate zero lines for each survey location.
MAPPING OUTPUTS
Bathymetry map images and pointsource models are generated from data collected during survey for each survey reach and / or zone. The bathymetry map is generated and exported in .MBTiles, .kml, .kmz, .png and .csv formats for use in online map presentation tools, during fish biomass data analysis and post processing and data review. See below for an example bathymetry map as displayed on Mapbox Studio. The bathymetry model helps to determine the physical characteristics of a site and where accepted tracks from biomass surveys sit in relation to it. The .kml, .kmz and .png all show the image while the .csv is for processing fish biomass data and not displayed.