DATA COLLECTION
Understanding fish behavior is crucial in aquaculture as it directly influences the health, growth, and overall productivity of farmed fish. Key reasons include:
1. Stress Management: Recognizing behavioral indicators of stress allows for timely interventions, minimizing adverse effects on immune function and disease resistance.
2. Feeding Efficiency: Insights into natural feeding behaviors enable the development of feeding strategies that optimize growth and reduce waste.
3. Social Dynamics: Understanding social interactions, such as dominance hierarchies and territoriality, helps in designing environments that minimize aggression and promote well-being.
4. Environmental Enrichment: Incorporating elements that cater to species-specific behaviors enhances welfare and reduces stress-related issues.
By integrating behavioural understanding into aquaculture practices, producers can enhance fish welfare, improve growth rates, and increase the sustainability of aquaculture operations. Infofish has focused on shallow water pondages, often low visibility, typical in Australian and Asian farms, as this mirrors our long term survey work in wild fisheries and our services support finfish farms in this space.
SAMPLE FREQUENCY
The sample frequency is typically set by the farm management in line with their animal management practices. There is no practical limit to the number of samples that can be taken, however when behaviour is considered there will be specific markers such as day vs night or feeding that will be of specific interest.
PRE-PLANNING
During the pilot phase for assessment, the appropriate method for data capture will be selected (sample or sweep). This may be a hybrid pattern as well with ongoing single timeseries sampling used most often with a scheduled sweep at specific intervals.
EQUIPMENTThe following equipment is used during the process:
- 1 x Biosonics DTX Extreme with 200KHz transducer for recording fish signals
- 1 x Garmin Live for recording activity around the net during validation
HANDLING OF DATA
Primary Biomass data is recorded via the Biosonics DTX unit while live sonar recordings come via the Garmin Live system.
- Biosonics DTX (data from transducer is received on the Biosonics DTX Extreme unit, then transmitted to recording laptop via network cable.) – This unit is dedicated to recording echograms of fish and environment for biomass assessment purposes.
- Garmin Live (data from transducer is received on Garmin head unit, then transmitted via wireless connection to tablet) – This unit is dedicated to recording live sonar videos of fish presence and behaviors.
PONDAGE MODEL
Pondage models are based on the four corners gps co-ordinates to establish boundaries, with additional midpoints recorded if needed. Depth can be updated every five meters to confirm pondage slope, or if there is minimal slope, only at points of change such as drainage points. The pondage model is required where the Biomass transducer is used in order that the water depth be incorporated into signal processing activities.
TRANSDUCER INSTALLATION
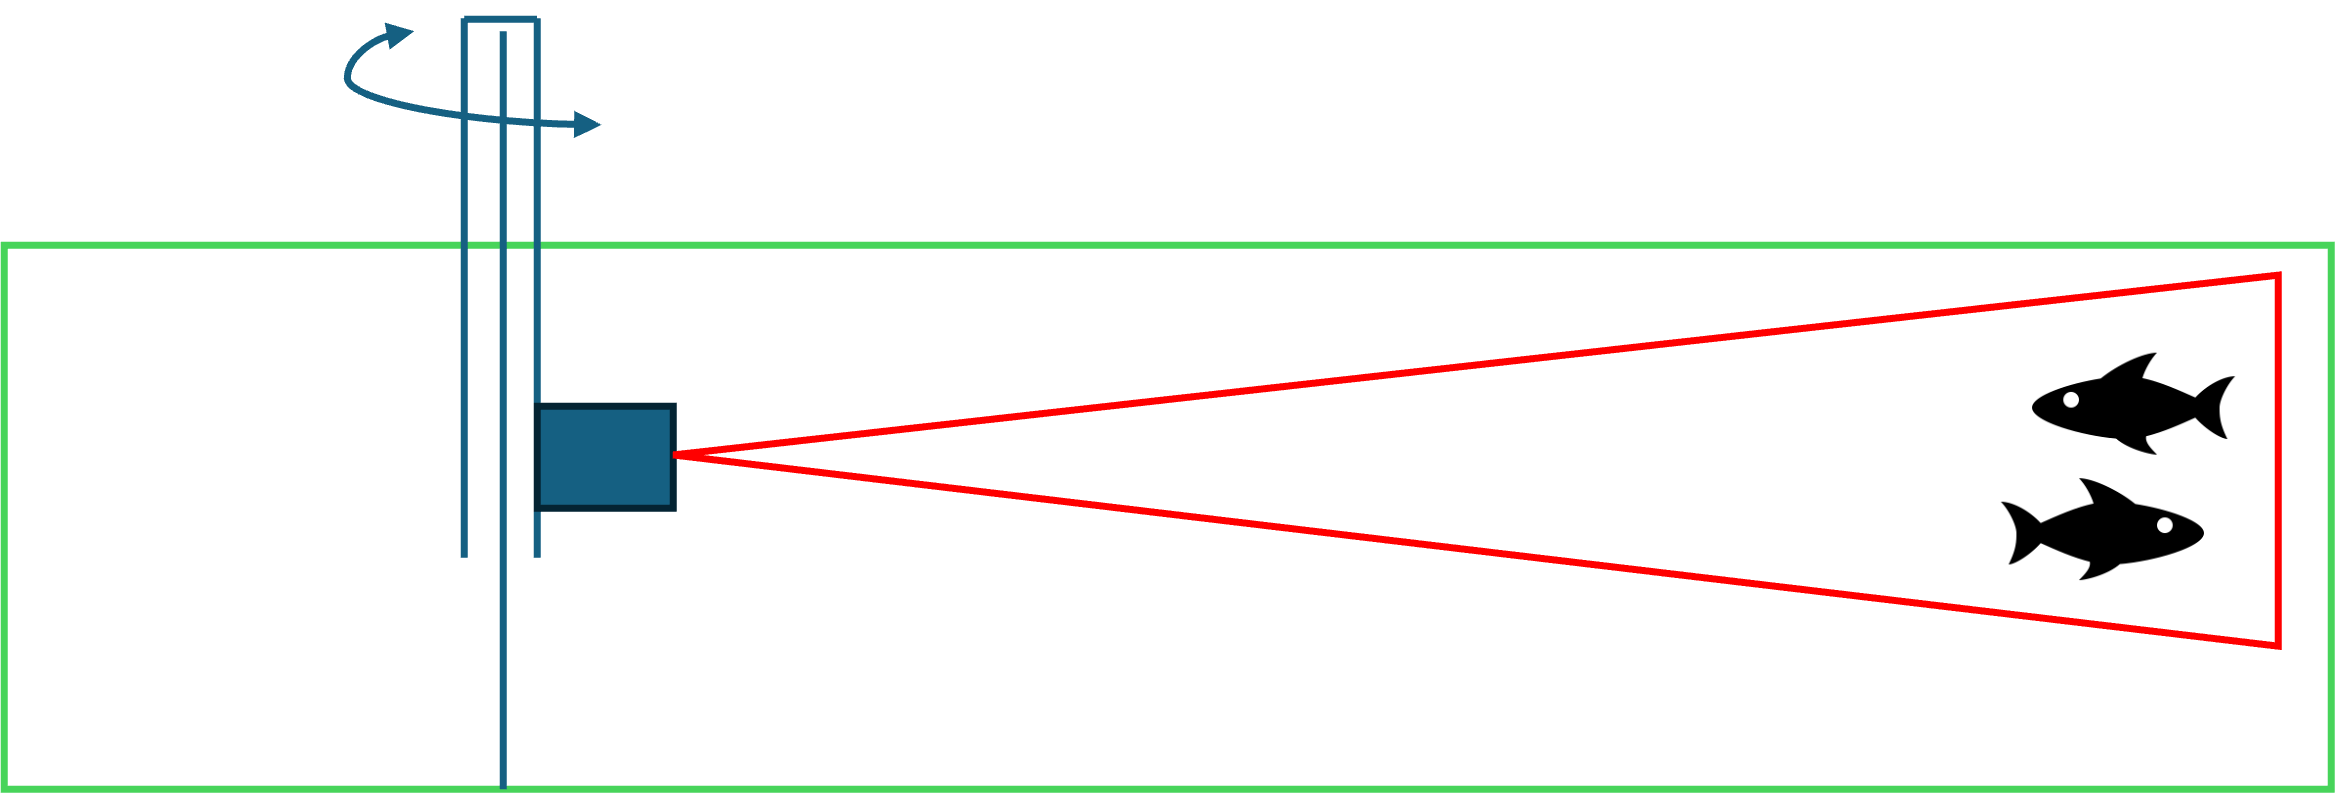
Sampling in a pondage environment will be from a fixed point in the pondage that has as unobstructed access to the main biomass as possible. This fixed point can be \a stake or star picket that the transducer will be mounted on using a sleave/collar over the mount point, this will enable the transducer to be swept across the pondage as per Figure 1, or the transducer can be mounted on a feeding platform ultimately this will be specific to the site. The objective of the mounting is simply to facilitate both a sweep motion and fixed position for the transducer with as little as possible vertical movement.
SAMPLE VS SWEEP METHODOLOGY
There are two methods for capturing data once the transducer is in place:
- Sweep – provides a sweep of the pondage, as per Figure 2 a-c.This can be either a full or partial sweep depending on known fish distribution in the pondage or if a point in the day is selected where fish aggregate such as feeding times.
- Time Series Sample – a fixed direction that targets a known volume of water that allows fish to pass freely in and out of the beam as per Figure 2 d.In this configurate recording is continuous with analysis focused on determining the fish in the survey area in a specific period of time, eg per minute with time periods in the sample compared and final analysis based on either fully across the time series or on average depending on the farm practices.
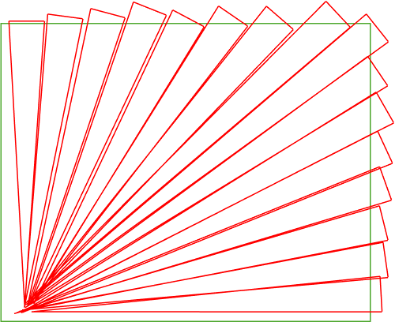
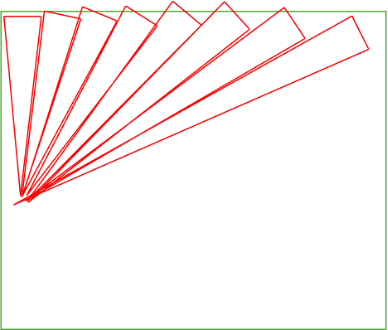
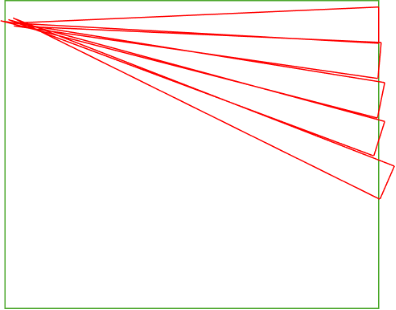
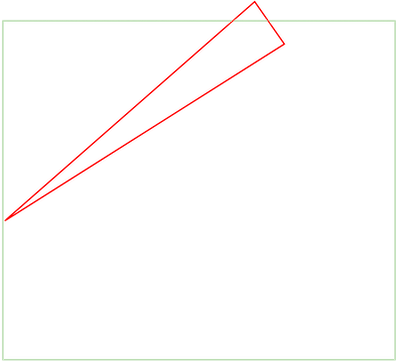
Figure 2 – Examples of Sweep and Sample versions of data collection
SIGNAL COLLECTION IN PONDAGE CONTEXT
In a pondage where the objective is to get clean signals of fish without a vessel the transducer is mounted in a single fixed point and data recorded over time as fish move through the beam. For assessing the best location to mount the transducer, Figure 3 provides an appropriate model of the beam depth over distance, which as the beam is a cone is also the width of the beam. The ration of distance to beam width is approximately 1:10. For example, at 20m the beam is covering an area 2m deep and 2m wide.
|
Survey Range (m) |
Cone Diameter at End Range (m) |
Water Volume Surveyed (m3) |
|
10 |
1.1 |
3.17 |
|
50 |
5.8 |
440 |
|
75 |
8.7 |
1,490 |
|
100 |
11.6 |
3,520 |
TARGET POSITIONING
In the case of a pondage, the objective is to keep the centre of the beam around mid-water at the target range. This can be achieved in a range of scenarios, where the transducer is mounted between 50cm from the surface to 50cm from the bottom. Figure 4 provides a range of models of the transducer beam. Targetting can be confirmed using an object that will be referenceable in the beam such as the Calibration cage/net available from Infofish Australia.
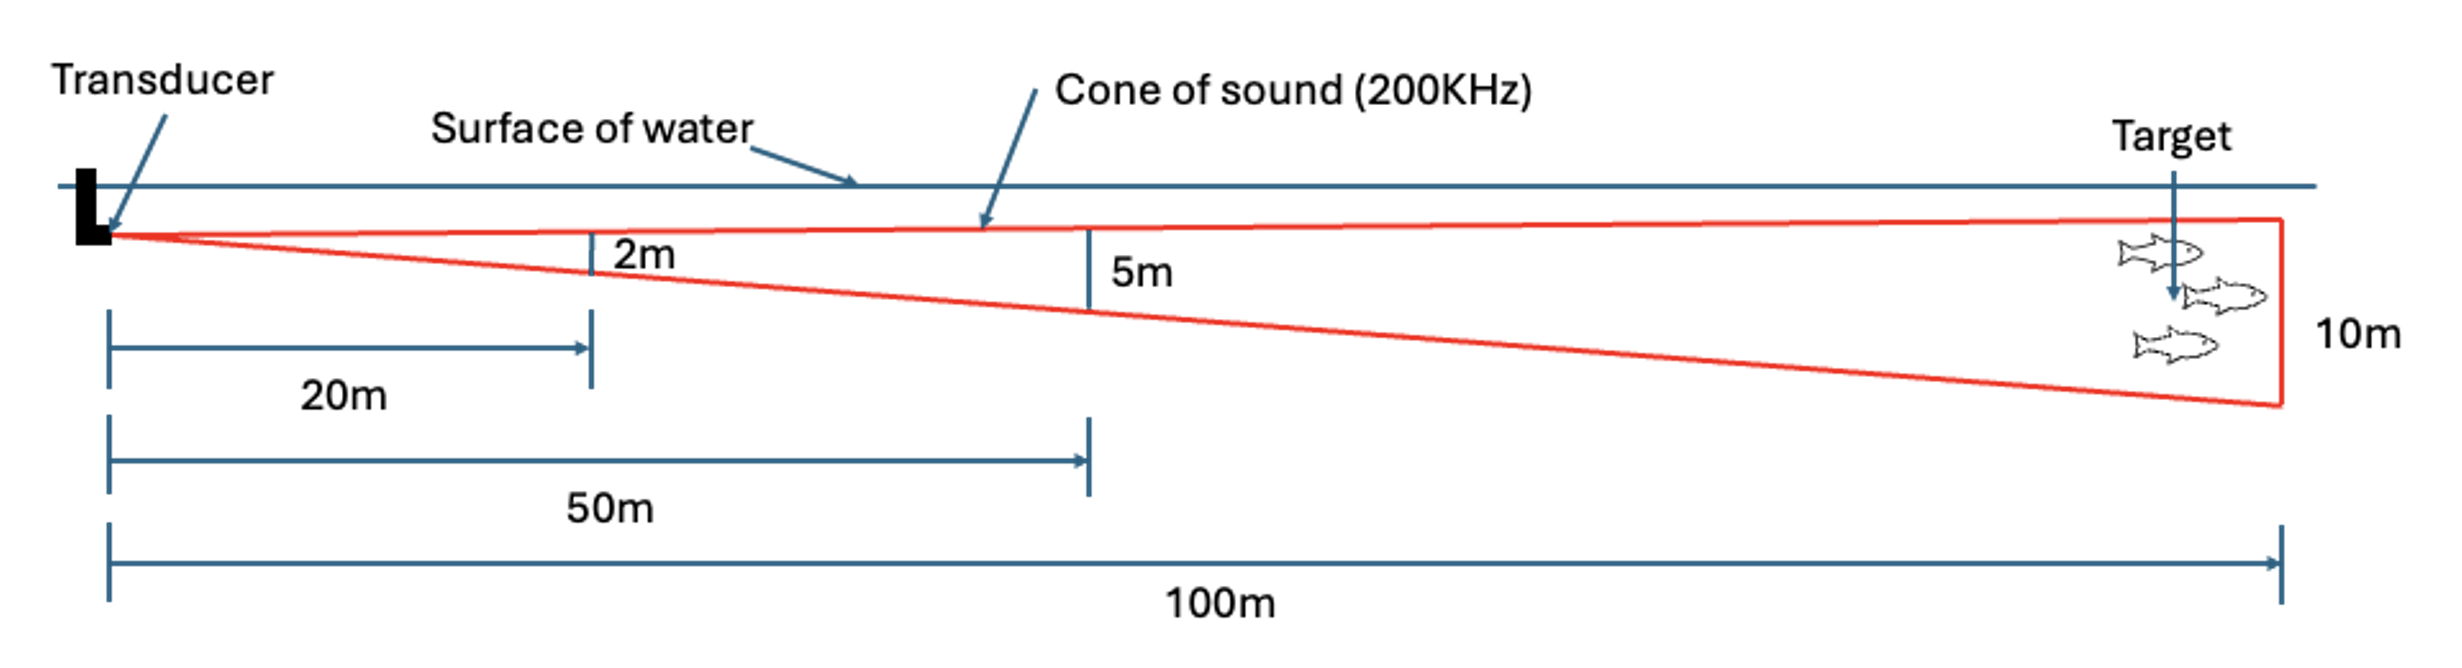
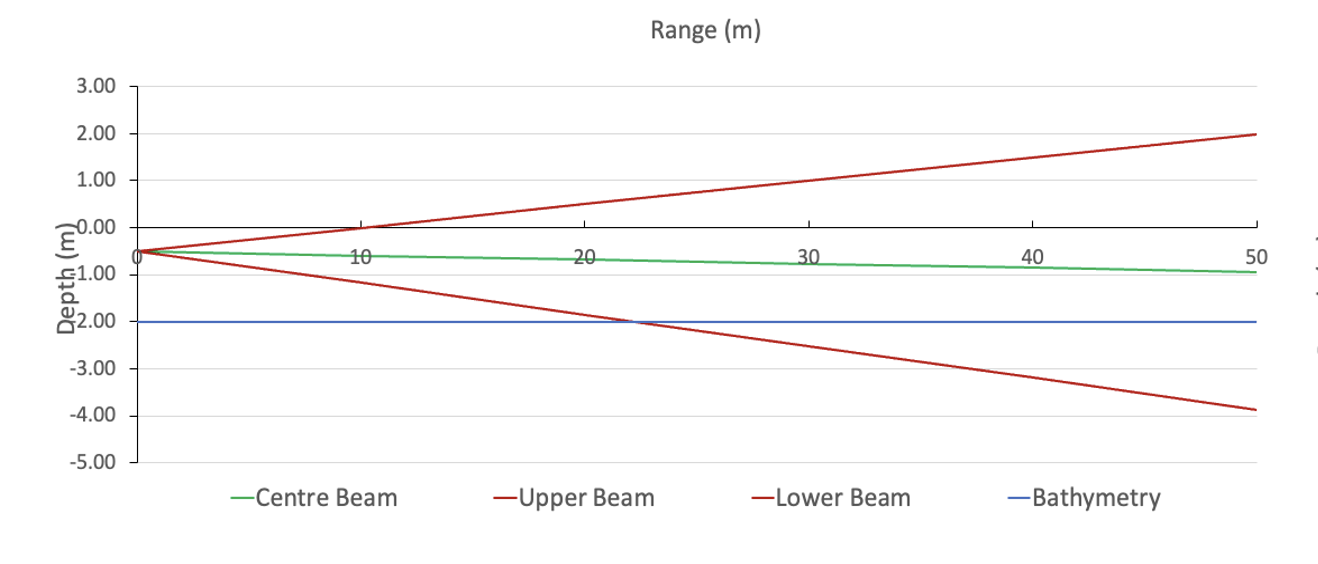
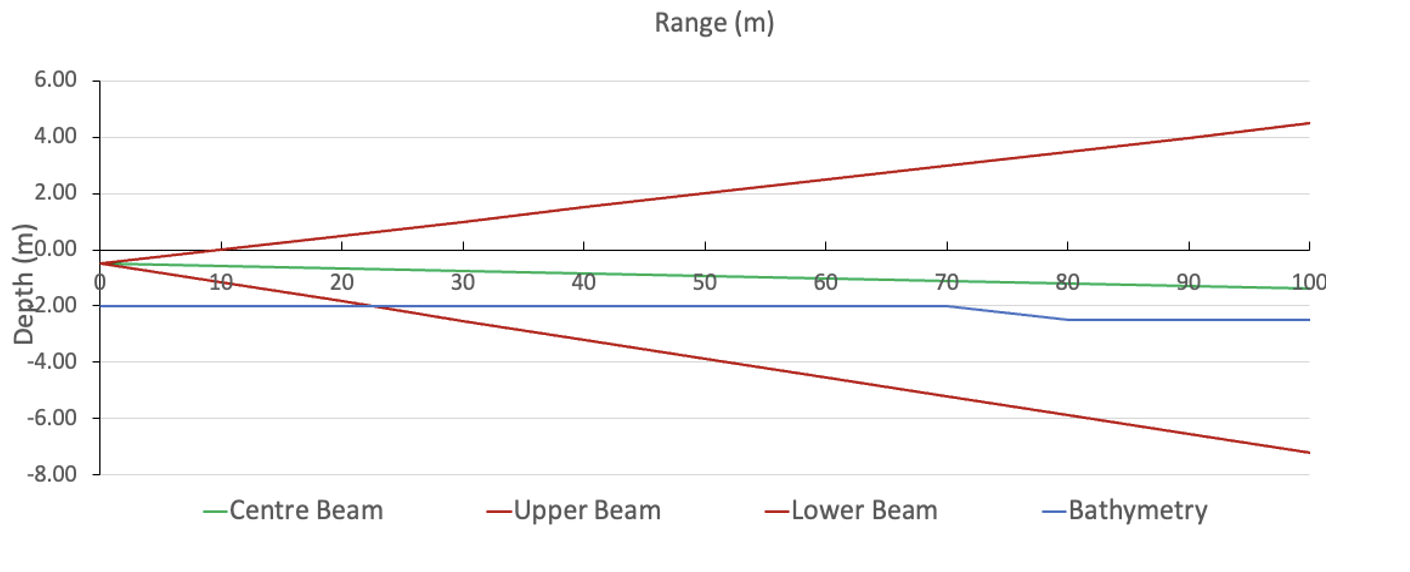
Figure 4 – Models of the beam from ranges 50m to 100m in a 2m pondage with a 2.5m maximum depth.
FISH BIOMASS DATA COLLECTION
Fish signal data are collected with the BioSonics DT-X split beam echo sounder and generated using the Visual Acquisition software package (BioSonics Inc. 2017). The software enables the user to set parameters such as:
- the ping rate (pings per second) – can be set between 1 and 10 and is dependent on the aims of the survey and types of data being collected.
- the pitch (angle of the beam) is monitored during the survey and adjusted by shifting weight in the boat.
During collection of data, those settings altered from default settings from manufacturer to reflect the requirements of the validation data collection exercise include:
- Ping rate – 5 pings per second
- Maximum range of data collection – 30m
- Water temperature (degrees celcius) – Provided on the day from Humminbird Helix 10 unit.
- Salinity (ppt) – Provided on the day from Salinity Probe
Autotrack, Biosonics system for assessing hydroacoustic signals and providing a list of tracks (collections of signals, considered a discrete object) is additionally configured with the following settings:
- Minimimum number of pings required to start a track – 2
- Minimum additional pings to accept track – 1
- Maximum ping gap – 0 (requires continuous pings on an object to be accepted)
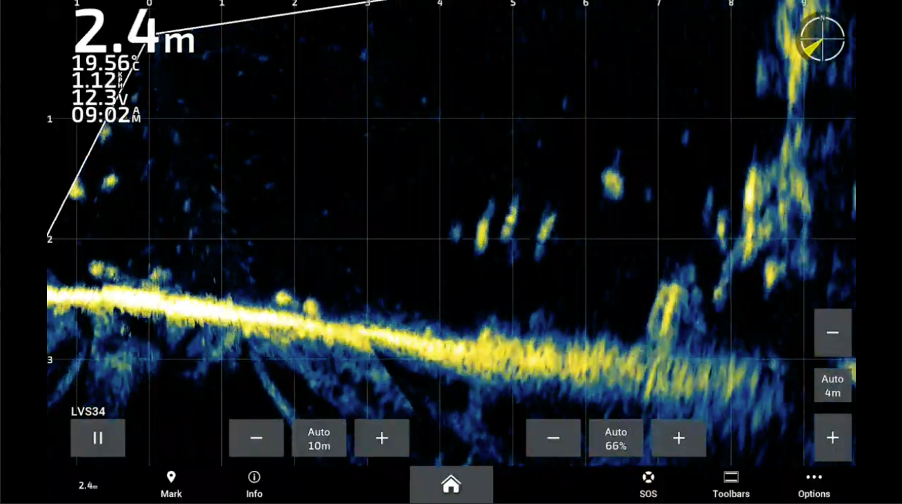
LIVE SCANNING SONAR
The fish live scanning transducer is able to record video of fish in the pondage even in turbid waters. This provides qualitative evidence of fish behaviors as movement and interactions between individual can be recorded in real time.
Live scanning sonar is done with the Garmin LiveScope transducer (LVS32 or LVS34), attached to a Garmin GPSMAP 8410xsv chart plotter. The transducer is mounted on top of the Biomass transducer and can be set to either forward looking, down looking or perspective mode (top down). Each mode provides a different view through the water within a 120-degree arc. Examples of transducer configuration from the Garmin website and stills from in house testing for each configuration are displayed in Figure 5.
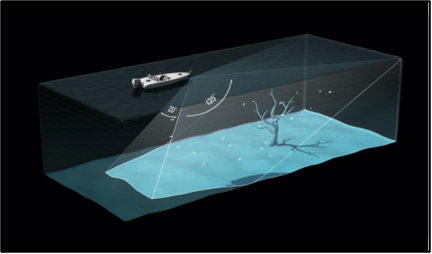
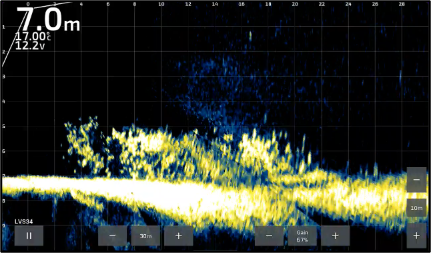
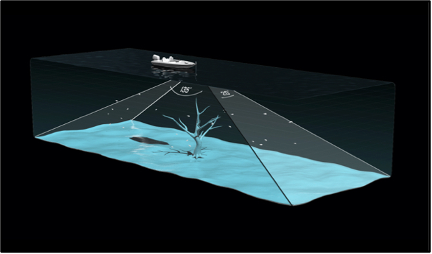
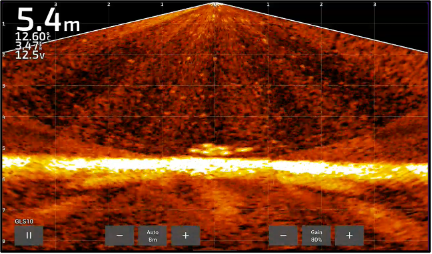
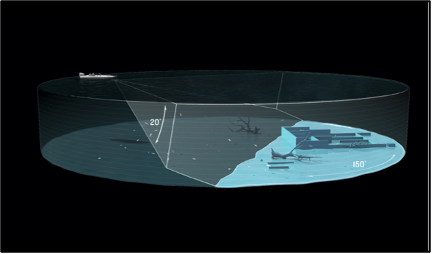
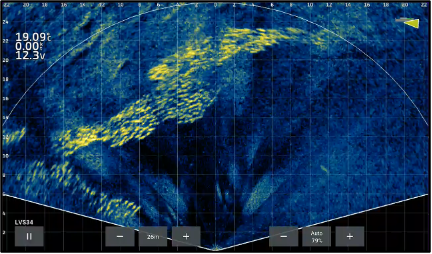
Figure 5 – Live scanning sonar transducer configurations and resulting views through the water column.
For behavior, the transducer is calibrated to know which direction it is pointing and fish targets or other points of interest within the beam are gps marked with latitude, longitude and depth information being captured. It is impossible to mark all fish observed with live sonar however, it provides an opportunity to assess what should be expected from the processed biomass survey results. Figure 6 shows the marking of fish in the live sonar beam in forward mode.
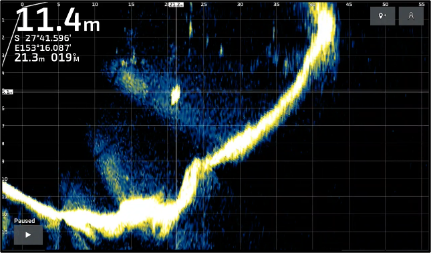
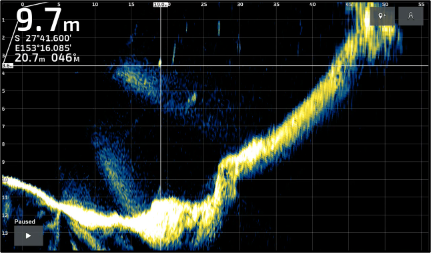
Figure 6 – Fish targets being gps marked during a general survey in forward mode.
ANALYSIS
ECHOGRAM REVIEW AND RE-ANALYSIS
The stages of the echogram review process are displayed in Figure 5, and show;
- a raw echogram
- the number of accepted raw tracks (in green) as collected during a survey
- the manual reduction of ‘noisy’ bottom echoes and how a fish track appears in a cross-section view of the echo sounder beam, sitting above the softer bottom noise (inset), and
- a re-analysed echogram where the noisy signals have been rejected (red pings) and the objects that returned at least 4 echoes (in this instance) have been accepted as a fish, or other object of interest.
Once the re-analysed echogram has been reviewed and the results are deemed acceptable the metadata for each echogram is exported from Visual Acquisition. The primary aim of review and re-analysis is to provide the post processor with a cleaner dataset. Other objects (wood, rocks, anthropogenic structures, etc.) will also meet the re-analysis echo criteria however, deciphering and classifying those included objects is where the machine learning based post processing is relied upon. It should be noted that in some instances, structure maps which single out harder objects are generated and included in the post processing to provide further points of reference, which improve the machine learning classifications, especially around larger fish.
Echogram re-analysed involves increasing the number of echoes that an object needs to return to be accepted. Typically, the raw data is re-analysed up to four times to separate more accurately:
- fish <200mm;
- fish >200mm; and
The structure analysis provides location data on objects that return higher decibel (-5 to -19dB) echoes. This analysis is combined with the fish >200mm analysis to assist in querying and differentiating the larger objects which all return louder echoes.
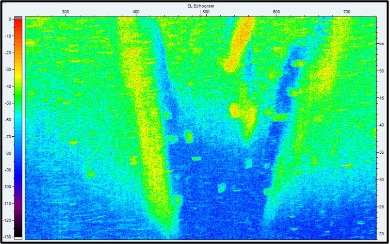
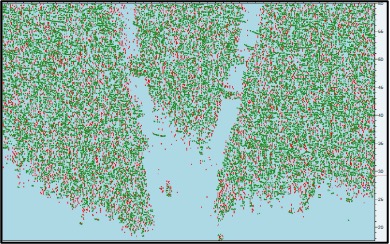
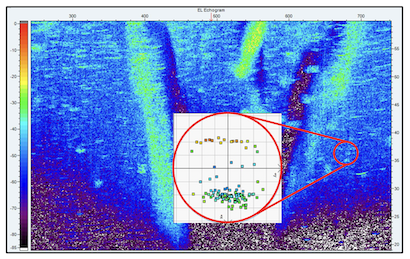
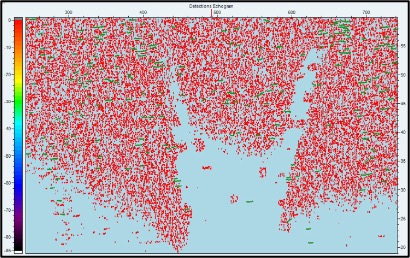
Figure 7- Example (plan view) of; a raw data echogram (a), raw, accepted and counted tracks in green (b), filtered bottom noise revealing fish tracks above the bottom (c) and re-analysed data to extract fish tracks from bottom noise noting the rejection of small rejection of smaller fish by red pings in the open water.
MACHINE LEARNING AND MODELLING
Machine learning based post processing and modelling is completed in RStudio and involves the following:
- Data is imported in its re-analysed format and aggregated into groups of transects collected in the same habitat type (e.g. open water impoundment), survey reach or zone. For example, if there are 10 tracks and all in the same region with the same habitat they are processed as one block. If two habitats types (e.g. open water / impoundment and riverine) have been surveyed, they are processed separately.
- Spatial information and the parameters used to assess individual objects e.g. signal standard deviations, signal angularity, etc., for identification purposes are generated.
- Individual objects are then assessed by a machine learning model, that is selected from a reference library of signal types. Once the object signal has been assessed, objects are assigned a classification e.g., sand, mud, rock, wood, fish, etc.
- Anomalous objects e.g., where pings have been stitched together erroneously by the Visual Acquisition software or where an object was detected beneath or deeper than the bathymetry in an area, are classified as such and removed from the data.
- Validation graphics and datasets are generated for individual transects, groups of transects, and whole surveys for review purposes.
- Client usable datasets are output, including pointcloud data, accepted fish tracks and summaries of detected fish and other objects of interest.
FISH BIOMASS ESTIMATES AND SIZE GRADING
The strength of the echo that an object returns, in decibels, is referred to as the target strength. The calculated average decibels of all echoes returned by an object is referred to as mean target strength (MTS). A relationship between fish length and mean target strength exists and it is from Love’s equation that the length of a fish can be calculated from its mean target strength. Love’s equation is as follows:

Where MTS is the mean target strength of an object and a and b values are constants derived from the linear regression equation describing the log transformed and plotted mean target strength data. Currently, many species of fish have been sampled hydracoustically in controlled environments and species-specific MTS to length relationship data is available and used when possible.
SPECIES ASSESSMENT
Species assessment is a process of comparing hydroacoustic parameters verses reference data. During the process of collecting data there are a wide array of hydroacoustic values recorded on targets, these can be used to assess species on a case-by-case basis. Ideally when assessing species fish cohorts from different species are assessed in the same conditions so as to differentiate the signals. Capturing species rederence data is covered in the Wild Fish Calibration survey method.
DATA OUTPUTS
SAMPLE SUMMARY
Two survey summaries are generated. The survey area is broken up into Zones (or a single zone), with a summary for each Zone broken down by survey transect as well as an overall summary file that aggregates all transects into a single group. These files provide an overview of the region surveyed including:
- Sample Reference
- Length of Transect
- Area swept (surface area)
- Number of pings for the transect
- Min, Max and Average depth of bathymetry of the transects
- Min, Max, Average, Variance and Standard Deviation of the transducer pitch angle
FISH SUMMARY
These files provide an overview of the recording session including:
Sweep mode
- Counts of fish by size broken up into 5cm increments
- Counts of clusters of fish (where more than one fish is detected in close proximity)
Sample mode
- Counts of fish by size broken up into 5cm increments, per time period interval (set in the data import profile)
- Counts of clusters of fish (where more than one fish is detected in close proximity), per time period interval (set in the data import profile)
FISH USE OF HABITAT
Two survey summaries are generated. As with other result files, survey area is broken up into Zones (or a single zone), with a summary for each Zone broken down by survey transect as well as an overall summary file that aggregates all transects into a single group. These files provide an overview of the region surveyed including:
- Counts of fish broken down by depth they were detected at
- Breakdown of the % of bathymetric depths fish detected in (<2m, 2-4m, 4-7m, 7-10m,10-15m,15-20m,20+m)
- Breakdown of the position in the water column (top 20%, 20-40%, 30-60%, 60-90%, bottom 10%)
- Proximity to pondage edge
- Proximity to any anthropogenic structures
ADDITIONAL DATA FILES
Several file sets are generated for mapping or client analysis including:
- Individual fish records (csv and shapefile)
For files with individual fish, the following is generated:
- Fish position (gps co-ordinates)
- Length (based on calibration data via regression or machine learning)
- Weight (from length weight curve)
- Depth of fish
- Target Strength
- Heading from transducer to fish (degrees)
- Range to fish from transducer (m)
- Beam positioning information (upper, lower and mid depth of beam when fish detected)
- Nearest anthropogenic habitat typing to fish (and range)
FISH DISTRIBUTION MAPPING
Fish distribution pointcloud data is available in GIS formats to map biomass in the pond. Where large numbers of fish are detected in a survey, heat maps may also be generated to define fish biomass aggregation or skewed distribution more clearly. Sample mapping can provided in Mapbox Studio for reference by the farm operator with links made available.
LIVE SCANNING SOFTWARE
Data recorded from the Live Scanning transducer comes in the format of an MP4 video playback of the recording session as well as a Garmin GPX file of any marked targets, that includes depth and gps location. In a behavior context, the recording file is time coded and synced to the biomass recording where targets are located spatially but also by time of recording. Additionally, if a target is tagged in the recording session on the Garmin unit, the time code, location and depth is recorded in the GPX as a secondary method of validation.
While the Garmin live cannot be used for biomass estimations based on size, it can be used as an additional method of identifying the numbers and density of fish present in a part of the pondage. Counts can be made from video frames, either directly or using image recognition software.