DATA COLLECTION
Common question(s) that typically prompt a survey are:
- How many fish are in the waterbody?
- How big or what range of sizes are the fish are in the waterbody?
- How are fish distributed throughout the waterbody and what habitats are they associating with?
- Are fish mobile or relatively still?
- What part of the water column are fish occupying?
- How many species of fish make up the assemblage or community within a site / waterbody?
Infofish Biomass mapping as a process is designed to provide maximum resolution biomass assessment as efficiently as possible.
SURVEY FREQUENCY
The survey frequency is typically project specific and dependent on the aims of the survey. Surveys can be as little as hours or up to months apart.
PRE-PLANNING
Depending on the need the survey transects are predesigned with prevailing winds and natural geography in mind, such that the operator can focus on the task of data collection, rather than decision making during the day. A typical startup pattern will include 100m separated parallel transects, with 2-3 orientations based on wind conditions, such that if wind patterns are not suitable changes can be made.
EQUIPMENT
The following equipment is used during the process:
- Survey Vessel, 4-4.2m Exemption 38 Vessel registered with AMSA for research purposes.
- 2 x Humminbird Helix 10 Units for recording bathymetry, gps locations/tracks and 1.2MHz/455MHz sidescan
- 1 x Biosonics DTX Extreme with 200KHz transducer for recording fish signals
SAFETY MANAGEMENT
As per AMSA requirements all surveys operate under a dedicated survey management plan that is designed to ensure the safe conducting of bathymetric surveys. A copy of our standard safety management plan is available from the Infofish Surveys Website (https://infofishsurveys.com.au) or email upon request.
HANDLING OF DATA
Data from the surveyed area is recorded on both of the Helix units during survey, so as to provide redundancy in case of a unit failure or other issue on water.
- Primary Unit (directly records sonar and gps data) – using the AutoChart feature and recorded to a Humminbird Zero Lines SD card for Australia.This unit is dedicated to recording bathymetric logs during the day.
- Secondry Unit (networked and taking data from the primary unit) -using a standard encrypted SD card. This unit is dedicated to recording sonar logs as well as backup bathymetric logs during the day. Sonar logs record raw data from the transducer including Sidescan and 2D data.
- Biosonics DTX (data from transducer is received on the Biosonics DTX Extreme unit, then transmitted to recording laptop via network cable.). This unit is dedicated to recording echograms of fish and environment for biomass assessment purposes.
HANDLING UNFORSEEN CONDITIONS
From time-to-time weather conditions or artifacts on water make operating using the pre-planned set of transects difficult to impossible. In this case, rather than halting survey, the operator can run a single line either parallel to land, or away from the edge as required, then use survey range rings on the Helix unit to continue with additional lines at the 100m spacing parallel to the starting line. This is done by setting the range required (100m) on the survey unit, which will draw a ring of the selected range as the radius and orienting the boat directionally parallel to the start line, using the radius of the range ring to keep a consistent distance from the start line. This can be continued as many times as needed allowing for surveys to continue even in unforeseen conditions.
DAILY REVIEW
Data collected during the survey day is uploaded and processed overnight at head office, for external review to determine if features that need additional data have been identified, and that data collected to data is of sufficient spacing to accurately develop a working biomass map.
ON WATER SURVEY
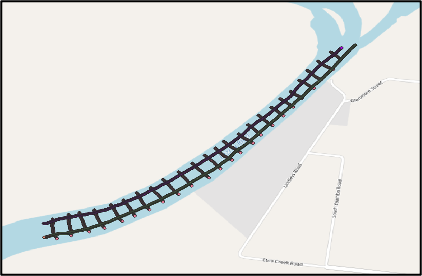
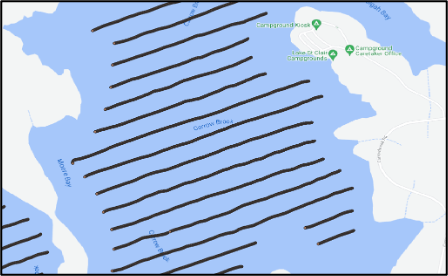
The waterbody is commonly an estuarine / riverine environment or enclosed waters e.g. dam / impoundment and the survey approach can vary slightly between the two. Survey reaches in a riverine environment are typically 1km in length but can be increased as necessary. Surveys in enclosed waters typically cover the whole body of water. See Figure 1 and Figure 2 for examples survey transects for a riverine reach survey and a section of dam / impoundment survey. In larger impoundments or open water surveys, predefined survey transects are generated in ReefMaster and installed into the fish finder to aid in vessel navigation. Once a survey reach (riverine) or zone (impoundment) has been defined, the survey methods for each are as follows:
Riverine
- two longitudinal transects (one upstream and one downstream) with the vessel travelling parallel to the right / starboard bank, and
- where the river is greater than 50m wide, a number of transects across the waterbody spaced 100m apart (water depth dependent), are surveyed.
Enclosed waters / impoundment
- a number of transects across the waterbody, spaced 100m apart. Transect are aligned so that the majority run perpendicular to the dam alignment and / or submerged river channel.
FISH BIOMASS
Fish biomass and distribution data collected with the BioSonics DT-X split beam echo sounder is generated using the Visual Acquisition[1] software package. The software enables the user to adjust parameters such as:
- the ping rate (pings per second) – can be set between 1 and 10 and is dependent on the aims of the survey and types of data being collected.
- the decibel threshold – the threshold below which echoes are rejected (small objects return low decibel echoes; larger objects return higher decibel echoes and hard surfaces return very high decibel echoes).
- the number of echoes an object needs to return to be classified as a ‘track’ – the sequential stitching together of echoes that are above the decibel threshold (the software counts only accepted tracks), and
- the maximum number of echoes an object needs to return for it to be deemed ‘too many’ – this setting is relaxed to allow all tracks to be counted. An object that is too big is accepted but not counted by the software.
During surveys, data collection parameters are always set to allow the greatest number of echoes and therefore tracks to be accepted by the Visual Acquisition software, termed ‘raw data’. For example, at a range of 200m, the following settings are used: 5 pings per second, a threshold of -60dB and at least 3 echoes received from an object to be classified as a track and counted. Five pings per second is the standard by which data is collected in all surveys.
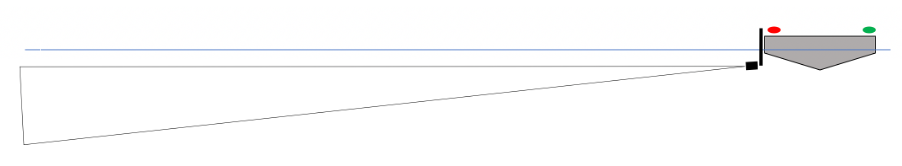
SIGNAL COLLECTION IN WILD CONTEXT
For biomass surveys, all data is collected with the transducer aimed to the port side of the vessel, angled downwards to -2 to -6 degrees below horizontal (Figure 3). The optimum angle is calculated prior to survey, based on pre-survey bathymetry modelling and will vary with depth e.g. shallower angles are used in shallower waters. With the transducer in this configuration, pings are sent, and echoes received from up to 200m away. The farther the range surveyed, the greater portion of water column is covered as the ping cone becomes wider. See Table 1 for estimates of ping cone width and water volumes surveyed in commonly used survey ranges.
|
Survey Range (m) |
Cone Diameter at End Range (m) |
Water Volume Surveyed (m3) |
|
10 |
1.1 |
3.17 |
|
50 |
5.8 |
440 |
|
75 |
8.7 |
1,490 |
|
100 |
11.6 |
3,520 |
|
200 |
23.3 |
28,400 |
TARGET POSITIONING
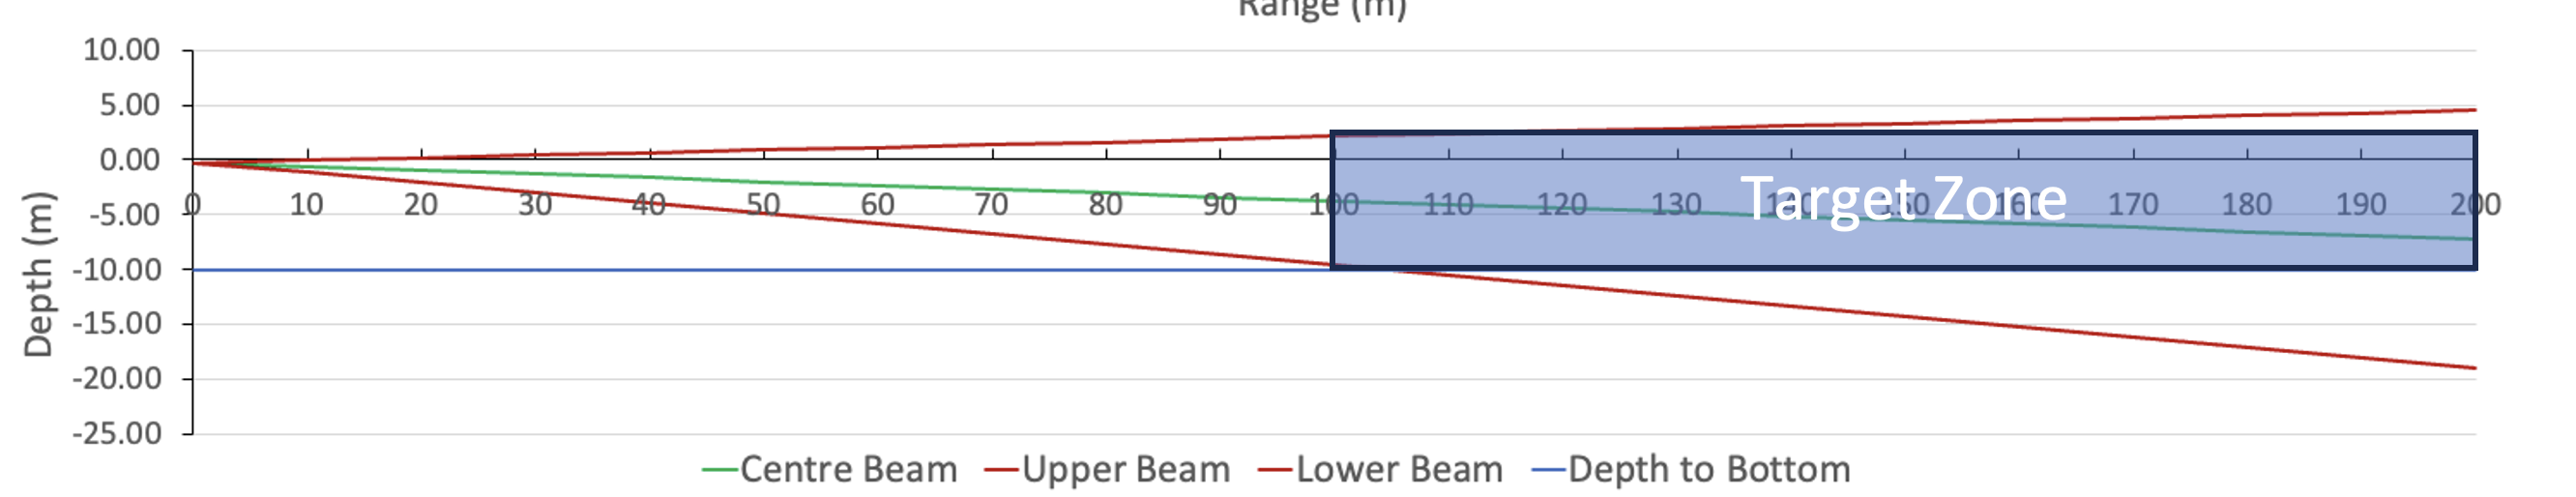
When considering the capture of signals, targeting needs to be controlled in order to ensure that clean signals are obtained. There are two key elements to targeting – direction (handled by vessel positioning) and area of coverage of the beam. That is, thinking of the beam as a torch beam, the direction of the beam needs to be pointed in the correct direction and confirmed. Additionally, the cone of the beam has to be pointed such that the beam passes through the net at an appropriate depth to capture the fish.
Managing the vertical proportion of the beam (the sound cone) is key to ensure the fish was captured, once the beam is targeted correctly. Infofish has a calculator available to calculate the correct pitch given the target range and bathymetry of the target area. Figure 4 has an example output for a depth of 10m with a target range of 100m-200m, which uses a pitch of 2 degrees.
FISH BIOMASS DATA COLLECTION
Fish signal data are collected with the BioSonics DT-X split beam echo sounder and generated using the Visual Acquisition software package (BioSonics Inc. 2017). The software enables the user to set parameters such as:
- the ping rate (pings per second) – can be set between 1 and 10 and is dependent on the aims of the survey and types of data being collected.
- the pitch (angle of the beam) is monitored during the survey and adjusted by shifting weight in the boat.
During collection of data, those settings altered from default settings from manufacturer to reflect the requirements of the validation data collection exercise include:
- Ping rate – 5 pings per second
- Maximum range of data collection – 30m
- Water temperature (degrees celcius) – Provided on the day from Humminbird Helix 10 unit.
- Salinity (ppt) – Provided on the day from Salinity Probe
Autotrack, Biosonics system for assessing hydroacoustic signals and providing a list of tracks (collections of signals, considered a discrete object) is additionally configured with the following settings:
- Minimimum number of pings required to start a track – 2
- Minimum additional pings to accept track – 1
- Maximum ping gap – 0 (requires continuous pings on an object to be accepted)
EFFECT OF BOTTOM
In side facing assessments the bottom of the water column cannot be directly measured using the Biomass transducer. Additionally, to correctly assess bottom signals, the bathymetry needs to be collected.
EFFECT OF BOTTOM REFERENCE DATA
Bathymetry data is collected using Humminbird Helix 10 fish finders during fish biomass surveys. Water depth data from the fish finders is recorded and stored on micro-SD card in the head units. Habitat recordings in the form of 455KHz/1.2MHz sidescan can also be collected at the same time in the record file to provide additional visual context to the underwater environment.
ANALYSIS
ECHOGRAM REVIEW AND RE-ANALYSIS
The stages of the echogram review process are displayed in Figure 5, and show;
- a raw echogram
- the number of accepted raw tracks (in green) as collected during a survey
- the manual reduction of ‘noisy’ bottom echoes and how a fish track appears in a cross-section view of the echo sounder beam, sitting above the softer bottom noise (inset), and
- a re-analysed echogram where the noisy signals have been rejected (red pings) and the objects that returned at least 4 echoes (in this instance) have been accepted as a fish, or other object of interest.
Once the re-analysed echogram has been reviewed and the results are deemed acceptable the metadata for each echogram is exported from Visual Acquisition. The primary aim of review and re-analysis is to provide the post processor with a cleaner dataset. Other objects (wood, rocks, anthropogenic structures, etc.) will also meet the re-analysis echo criteria however, deciphering and classifying those included objects is where the machine learning based post processing is relied upon. It should be noted that in some instances, structure maps which single out harder objects are generated and included in the post processing to provide further points of reference, which improve the machine learning classifications, especially around larger fish.
Echogram re-analysed involves increasing the number of echoes that an object needs to return to be accepted. Typically, the raw data is re-analysed up to four times to separate more accurately:
- fish <200mm;
- fish >200mm; and
The structure analysis provides location data on objects that return higher decibel (-5 to -19dB) echoes. This analysis is combined with the fish >200mm analysis to assist in querying and differentiating the larger objects which all return louder echoes.
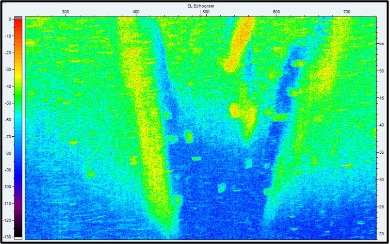
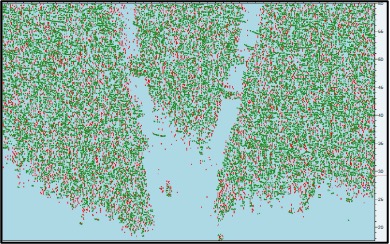
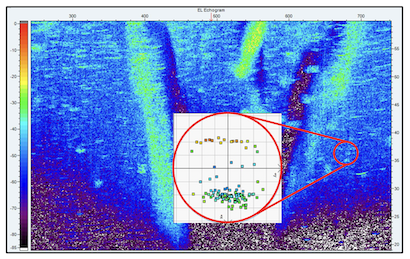
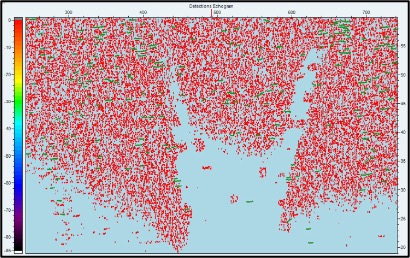
Figure 5- Example (plan view) of; a raw data echogram (a), raw, accepted and counted tracks in green (b), filtered bottom noise revealing fish tracks above the bottom (c) and re-analysed data to extract fish tracks from bottom noise noting the rejection of small rejection of smaller fish by red pings in the open water.
MACHINE LEARNING AND MODELLING
Machine learning based post processing and modelling is completed in RStudio and involves the following:
- Data is imported in its re-analysed format and aggregated into groups of transects collected in the same habitat type (e.g. open water impoundment), survey reach or zone. For example, if there are 10 tracks and all in the same region with the same habitat they are processed as one block. If two habitats types (e.g. open water / impoundment and riverine) have been surveyed, they are processed separately.
- Spatial information and the parameters used to assess individual objects e.g. signal standard deviations, signal angularity, etc., for identification purposes are generated.
- Individual objects are then assessed by a machine learning model, that is selected from a reference library of signal types. Once the object signal has been assessed, objects are assigned a classification e.g., sand, mud, rock, wood, fish, etc.
- Anomalous objects e.g., where pings have been stitched together erroneously by the Visual Acquisition software or where an object was detected beneath or deeper than the bathymetry in an area, are classified as such and removed from the data.
- Validation graphics and datasets are generated for individual transects, groups of transects, and whole surveys for review purposes.
- Client usable datasets are output, including pointcloud data, accepted fish tracks and summaries of detected fish and other objects of interest.
FISH BIOMASS ESTIMATES AND SIZE GRADING
The strength of the echo that an object returns, in decibels, is referred to as the target strength. The calculated average decibels of all echoes returned by an object is referred to as mean target strength (MTS). A relationship between fish length and mean target strength exists and it is from Love’s equation that the length of a fish can be calculated from its mean target strength. Love’s equation is as follows:

Where MTS is the mean target strength of an object and a and b values are constants derived from the linear regression equation describing the log transformed and plotted mean target strength data. Currently, many species of fish have been sampled hydracoustically in controlled environments and species-specific MTS to length relationship data is available and used when possible.
SPECIES ASSESSMENT
Species assessment is a process of comparing hydroacoustic parameters verses reference data. During the process of collecting data there are a wide array of hydroacoustic values recorded on targets, these can be used to assess species on a case-by-case basis. Ideally when assessing species fish cohorts from different species are assessed in the same conditions so as to differentiate the signals. Capturing species rederence data is covered in the Wild Fish Calibration survey method.
DATA OUTPUTS
SURVEY SUMMARY
Two survey summaries are generated. The survey area is broken up into Zones (or a single zone), with a summary for each Zone broken down by survey transect as well as an overall summary file that aggregates all transects into a single group. These files provide an overview of the region surveyed including:
- Transect Reference
- Start/End Co-ordinates for each transect
- Length of Transect
- Area swept (surface area)
- Number of pings for the transect
- Min, Max and Average depth of bathymetry of the transects
- Min, Max, Average, Variance and Standard Deviation of the transducer pitch angle
HABITAT SUMMARY
Two survey summaries are generated. As with other result files, survey area is broken up into Zones (or a single zone), with a summary for each Zone broken down by survey transect as well as an overall summary file that aggregates all transects into a single group. These files provide an overview of the region surveyed including:
- Min, Max and Average, Median and Mode of depth of bathymetry of the transects
- Min, Max and Average, Median and Mode of the slope of the bottom
- Breakdown of the % of water depths (<2m, 2-4m, 4-7m, 7-10m,10-15m,15-20m,20+m)
- Count of detections of autocoded wood or rock
- Min, Max and Average, Median and Mode of how close autocoded habitat was detected to the waters edge
- Min, Max and Average, Median and Mode of the depth of water autocoded habitat was detected in
- Count of detections of Clay, Sand, Gravel and Rock (as well as percentages of each)
FISH SUMMARY
Two survey summaries are generated. As with other result files, survey area is broken up into Zones (or a single zone), with a summary for each Zone broken down by survey transect as well as an overall summary file that aggregates all transects into a single group. These files provide an overview of the region surveyed including:
- Counts of fish by size broken up into 10cm increments
- Counts of clusters of fish (where more than one fish is detected in close proximity)
- Counts of bait balls detected (small fish)
FISH USE OF HABITAT
Two survey summaries are generated. As with other result files, survey area is broken up into Zones (or a single zone), with a summary for each Zone broken down by survey transect as well as an overall summary file that aggregates all transects into a single group. These files provide an overview of the region surveyed including:
- Counts of fish broken down by depth they were detected at
- Breakdown of the % of bathymetric depths fish detected in (<2m, 2-4m, 4-7m, 7-10m,10-15m,15-20m,20+m)
- Breakdown of the bottom slope detected over (<5o, 5-10o, 10-15 o, 15-30 o,30-45 o,>45 o)
- Counts of fish broken down by nearest bottom type (Clay, Sand, Gravel, Rock)
- Min, Max and Average distance to manually or automatically coded weed, wood or rock
- Breakdown of the position in the water column (top 20%, 20-40%, 30-60%, 60-90%, bottom 10%)
SPECIES SUMMARY
If species detection is enabled a summary is generated by species, that provides the species specifics breakdowns with the same data as the fish summary as well as the fish use of habitat.
ADDITIONAL DATA FILES
Several file sets are generated for mapping or client analysis including:
- Vessel tracks (csv and shapefile)
- Bottom typing (csv and shapefile)
- Individual fish records (csv and shapefile)
- Species specific fish records (csv and shapefile)
For files with individual fish, the following is generated:
- Species coding information
- Fish location – gps co-ordinates
- Est Length (average of loves length formula and salmonid length formula)
- Est Weight (from length weight curve)
- Depth of fish
- Target Strength
- Heading from vessel to fish (degrees)
- Range to fish from vessel (m)
- Beam positioning information (upper, lower and mid depth of beam when fish detected)
- Bottom type nearest fish
- Nearest habitat typing to fish (and range)
FISH DISTRIBUTION MAPPING
Fish distribution pointcloud data is reviewed in QGIS. The objects classified as fish are displayed over the bathymetry map (Figure 6) and habitat map (Figure 7) from a survey area. Where large numbers of fish are detected in a survey, heat maps may also be generated to define fish biomass aggregation or skewed distribution more clearly (Figure 8). All mapping is displayed in Mapbox Studio with links made available.